
Author: Stephanie Hamilton
Editors: Noah Steinfeld, Sarah Kearns, Zuleirys Santana-Rodriguez, Whit Froehlich
There is a lot we don’t know about our universe. In fact, all of our laws of physics describe only the ordinary matter and energy that surrounds us, a mere 5% of the total matter and energy in the universe. Little is known about the remaining 95%, comprised of dark matter and dark energy. Setting aside their unbearably creative names, dark matter and dark energy are two of the biggest mysteries in cosmology today. What are they made of? How do they interact with the regular matter we’re already familiar with?
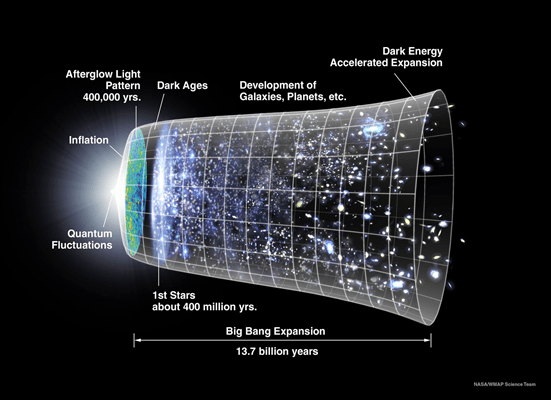
The focus of this article will be dark energy (dark matter could fill an entire post on its own!). In the 1920s, scientists discovered that our universe is expanding, but it wasn’t until 1998 that we discovered that the rate of this expansion is accelerating. This finding was thoroughly unexpected. Since gravity is an attractive force, most scientists expected the gravitational attraction between galaxies to cause the expansion rate of the universe to slow down. Discovering that the expansion rate is actually increasing suggests that an additional, repulsive force is pushing galaxies apart at increasingly faster rates as time goes on. This force has been given the name “dark energy” although, truthfully, we have no idea what it really is — is it a new fundamental force of nature, an intrinsic property of empty space, or something else entirely? One of the big questions astronomers are trying to answer is how dark energy has behaved over the age of the universe: has it had a constant effect (i.e. the so-called “cosmological constant” proposed by Albert Einstein in the early 1900s) for the past 14.5 billion years, like a persistent wind? Or have its effects instead varied during that time, perhaps like a steadily increasing wind leading to the climax of a storm or a changing wind on a particularly blustery day?
Enter the Dark Energy Survey (DES). DES is the most ambitious cosmology experiment to date, with the goal of imaging the faintest objects in the largest area of sky ever attempted by a ground-based survey (this is in contrast to space-based surveys, which have no atmosphere to contend with and the ability to measure the entire sky without needing to be exactly on the Earth’s equator). Over the course of five years, DES astronomers are using a new camera installed on the 4-meter Blanco telescope in Chile to measure galaxies as far as 6 billion light-years away — that is, DES astronomers aim to observe light emitted 6 billion years ago from distant galaxies that is just reaching the earth now! Nearby galaxies are easily discerned from those that are 6 billion light-years away using the concept of “redshift” — as light travels across an expanding universe, the distance between successive peaks of the light wave increases due to the expansion. This increases the wavelength of the light and makes light from farther away appear redder. With a dataset of hundreds of millions of galaxies in hand, from very nearby to 6 billion light-years away, astronomers will be able to study, very precisely, the (relatively) recent history of the universe for the first time.
Probing the Nature of Dark Energy
Prior to DES, the best results on dark energy came from the Planck survey, a space-based experiment. While Planck’s results are spectacular, they are derived by studying the Cosmic Microwave Background (CMB), the earliest light emitted when the universe was only 380,000 years old. Why should we expect cosmological parameters from the infant universe to still hold true today? After all, a lot of time has passed since then — 13.5 billion years, to be exact.
DES was designed precisely to address this issue. It will measure four specific astrophysical quantities, each yielding different but complementary pieces of the dark energy puzzle, and shine a light in the dark universe and learn about dark energy from the late-time universe (i.e. post-CMB….yes, 13.5 billion of the 13.8 billion years of our universe’s existence are considered “late-time”). The recent results from DES measured two of these four quantities:
- Baryon Acoustic Oscillations (BAOs) originate from tiny perturbations in the hot plasma in the early universe and the resulting outward-traveling waves that were “frozen out” as the universe cooled. Those frozen waves have since been blown up in scale, like a circle drawn on a balloon expanding as the balloon is inflated, and now correspond to a distance of about 500 million light-years. As such, we are slightly more likely to find galaxies separated by this distance than by 400 million or 600 million light-years, for example. By tracing BAOs through time and studying how “clumpy” the universe seems to be, we can learn how much dark energy there is and how strong its effects must be to produce the expansion we observe.

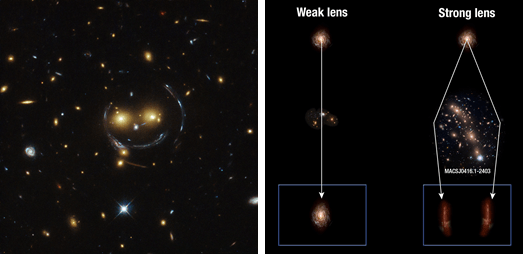
- Weak Gravitational Lensing is an extremely subtle distortion of both the positions and shapes of background galaxies by a relatively small foreground mass, caused by the bending of light around the foreground mass. Extreme gravitational lensing by very large masses results in the striking arcs seen by eye with strong lensing (my favorite example is the left panel of Fig. 3). Conversely, weak lensing is only detected statistically by very precisely and accurately measuring the distortions and alignments of millions of galaxies. By using the observed distortions in galaxy shapes and positions, astronomers use weak lensing to reverse-engineer what the intervening mass must look like in order to produce those distortions. In doing so, they also measure the total matter content of the universe (not just the visible matter!) and trace the evolution of the largest-scale structures (galaxy clusters and the intervening dark matter) over time.
By studying weak lensing and BAOs jointly, DES astronomers can learn about both the “clumpiness” of our universe, and therefore the strength of dark energy, and the total matter content of the universe.
Results
Drumroll, please…..
And here are the results! The key things to take from this plot are as follows:
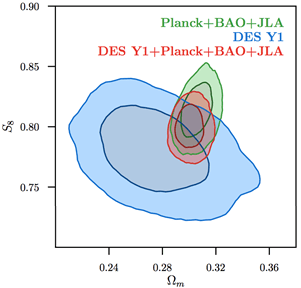
- Notice the three colored ellipses, corresponding to confidence interval contours and with darker colors corresponding to higher probability. The blue shows the recent results from DES, the green shows the best combined results prior to DES (which includes Planck and the CMB), and the red is what happens when the blue and green ellipses are combined. Note that their areas all overlap, indicating agreement between all results thus far! You might notice the slight offset between the centers of the ellipses— this apparent discrepancy is an active area of research, and we currently need more data to determine whether the offset is real or merely a chance fluctuation in the current dataset that may disappear with additional data. DES will provide the answer in the coming years!
- Look now at the x-axis, Ωm (§25.1.1). This quantity represents the fraction of the total matter-energy of the universe that is made of matter (dark+ordinary). The DES+Planck data yield Ωm = 0.301+0.006-0.008, meaning ~30% of the energy-matter budget is comprised of matter. This is the most precise result yet and agrees fantastically with previous results!
- Finally, look at the y-axis, S8 (§25.1.4). This parameter gives an estimate of how clumpy the matter in the universe was just after the Big Bang — small values mean smaller density variations (like plain yogurt) while larger values mean larger variations (think yogurt with lots of fruit and granola clusters). DES+Planck data yield S8 = 0.799 +0.014-0.009, again, the most precise result yet. Since S8 ranges in values from 0 to 1, the DES result means that our universe was relatively clumpy, but not as clumpy as it could have been. By comparing Ωm (the density of matter now) with S8 (the density of matter just after the Big Bang), we can learn how the universe has grown in the intermittent billions of years and thus how dark energy has affected the expansion of the universe.
- These results assume the prevailing cosmological model, ΛCDM. Pronounced “Lambda-CDM,” this model describes a universe in which most matter is dark matter and dark energy’s effects are constant through the entire history of the universe, our “persistent wind”. For completeness’ sake, DES astronomers also examined how their results changed when dark energy’s effects are not strictly constant in time. The resulting class of models that was tested is more general than ΛCDM, with ΛCDM being only one specific model within the larger superset. This means that ΛCDM could still be returned as the best solution. Lo and behold, this is exactly what DES astronomers found, so ΛCDM (i.e. dark energy whose effects are constant in time) remains the favored model of cosmology!
Why are these results so exciting? The most precise measurements of dark energy thus far have been made by studying the CMB. On the other hand, DES aims to produce similarly precise measurements of the universe from about 6 billion years ago until the present day. And they agree spectacularly well! The scale of this feat was summarized nicely in the press release announcing these results:
“Imagine planting a single seed and, with great precision, being able to predict the exact height of the tree that grows from it. Now imagine traveling to the future and snapping photographic proof that you were right. “
Never before has a ground-based survey studying the late-time universe been able to produce cosmology results competitive with those obtained from the CMB, primarily because the measurement of weak lensing requires an enormous sample of galaxies, such as what DES provides. And DES is just getting started — these results used only 30% of the anticipated final data set. The best is yet to come!
Additional References
These results are summarized in the first paper located in the link below. If you’re feeling especially ambitious, feel free to browse through any of the other 10 papers that contributed to the analysis:
https://www.darkenergysurvey.org/des-year-1-cosmology-results-papers/
About the author:
 Stephanie Hamilton is a 4th-year physics graduate student and NSF graduate fellow at the University of Michigan. Her work focuses on studying the orbits of the small bodies beyond Neptune in order learn more about the Solar System’s formation and evolution, in addition to discovering many more of these small bodies using a fancy new camera developed by the Dark Energy Survey Collaboration. Outside of work, she likes to read sci-fi books, binge TV shows, write about her travels or new science results, or force her cat to cuddle with her.
Personal website: stephaniejhamilton.com
LinkedIn: linkedin.com/in/stephanie-j-hamilton
Twitter: @StephHamy820
Read all of Stephanie’s posts here.
